Trendvest Ratings Performance Record |
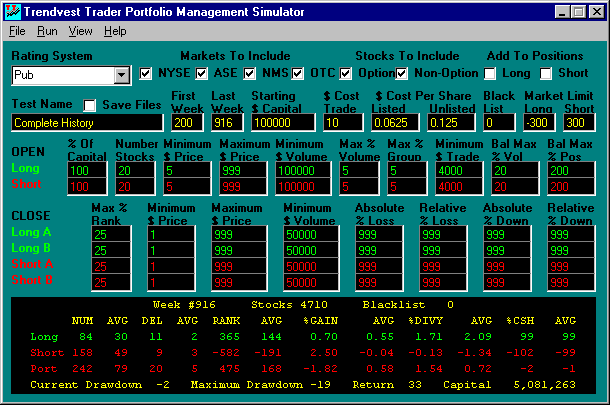
Straight Talk about Performance by Larry ChristyAnyone who has been in the investment business more than a week knows that there is no shortage of lavish performance claims by all sorts of publications. To put it bluntly, there is a lot of exaggeration in this field and you should be skeptical of every performance record you see. I'm especially wary of those charts showing up and down arrows which perfectly identified every buy and sell point since the publication began. If even a handful of the ones I've seen over the years were true, all the money in the world (if not the universe) would be in the hands of those people fortunate enough to follow the advice being sold for a mere pittance. The well documented truth is that the average stock portfolio over a long period of time makes about 11% per year. An enormous amount of time and money is spent every day trying to beat that average. Some of the brightest and best financed people in business spend their careers working on Wall Street. You may be one of them. You also may have a real job, a real life, and a real family that occupies your time. If so, can you compete with the pros? Yes, if you are willing to take responsibility for you investments and devote some serious attention to your portfolio. That's probably what brought to this page. Our initial goal was to develop a system that would produce a 15% annual rate of return. Most people using our hedge portfolio system today should be doing at least twice that well. The key question now is whether Trendvest can help you make more money than you could using your own methods or the assistance of other services. For most people, I believe the answer is yes. We have an excellent record of helping both professional and private investors for what seems like an eternity in electronic publishing. We first went online with NewsNet in 1984 and I can remember, not so fondly, of routine "all nighters" transmitting text files over a 1200 baud modem from ten p.m. until five or six a.m. Very few electronic publishers have been around that long. Trading Simulator Example There are many ways to look at investment performance, but only one should really matter to you -- the bottom line profits you make with your real time, real money portfolio. The charts you see on this page will give you an indication of how accurate Trendvest Ratings have been over the years. They can't predict how much money you'll make using them. Every investor has his or her own unique investment situation: amount of capital, commission costs, quality of executions, markets traded, holding periods, etc. If you would like to like to get an idea of the real net profits you personally would likely make using the Trendvest System, please check out our Trendvest Trading Simulator. It offers the most realistic way for investors to test the Trendvest System using parameters based on their own particular situation. The following screen illustrates how our hedge system has worked under actual portfolio management conditions since our first publication on December 31, 1983. It shows how an investor could have turned $100,000 into $5,081,263 in less than 14 years starting with a hedge of 20 long and 20 short stock positions. This period covers our entire published history with lots of market ups and downs (the crash of 1987, for example). |

|
|
Free Summary · Basic Text · Custom Analysis · What's New · About Trendvest · Performance Record · Help - System Guide · Thirders Foundation |
© Copyright 16 Feb 2001 Trendvest Corporation. All Rights Reserved.